Hot CPI Hits a Stretched Tape as Oil Sits on the Volatility Switch
Hot CPI, energy-driven inflation pressure, elevated volatility, ES/NQ/RTY quarterly +1SD alerts, and crude pressing near the upper daily expected-move band.
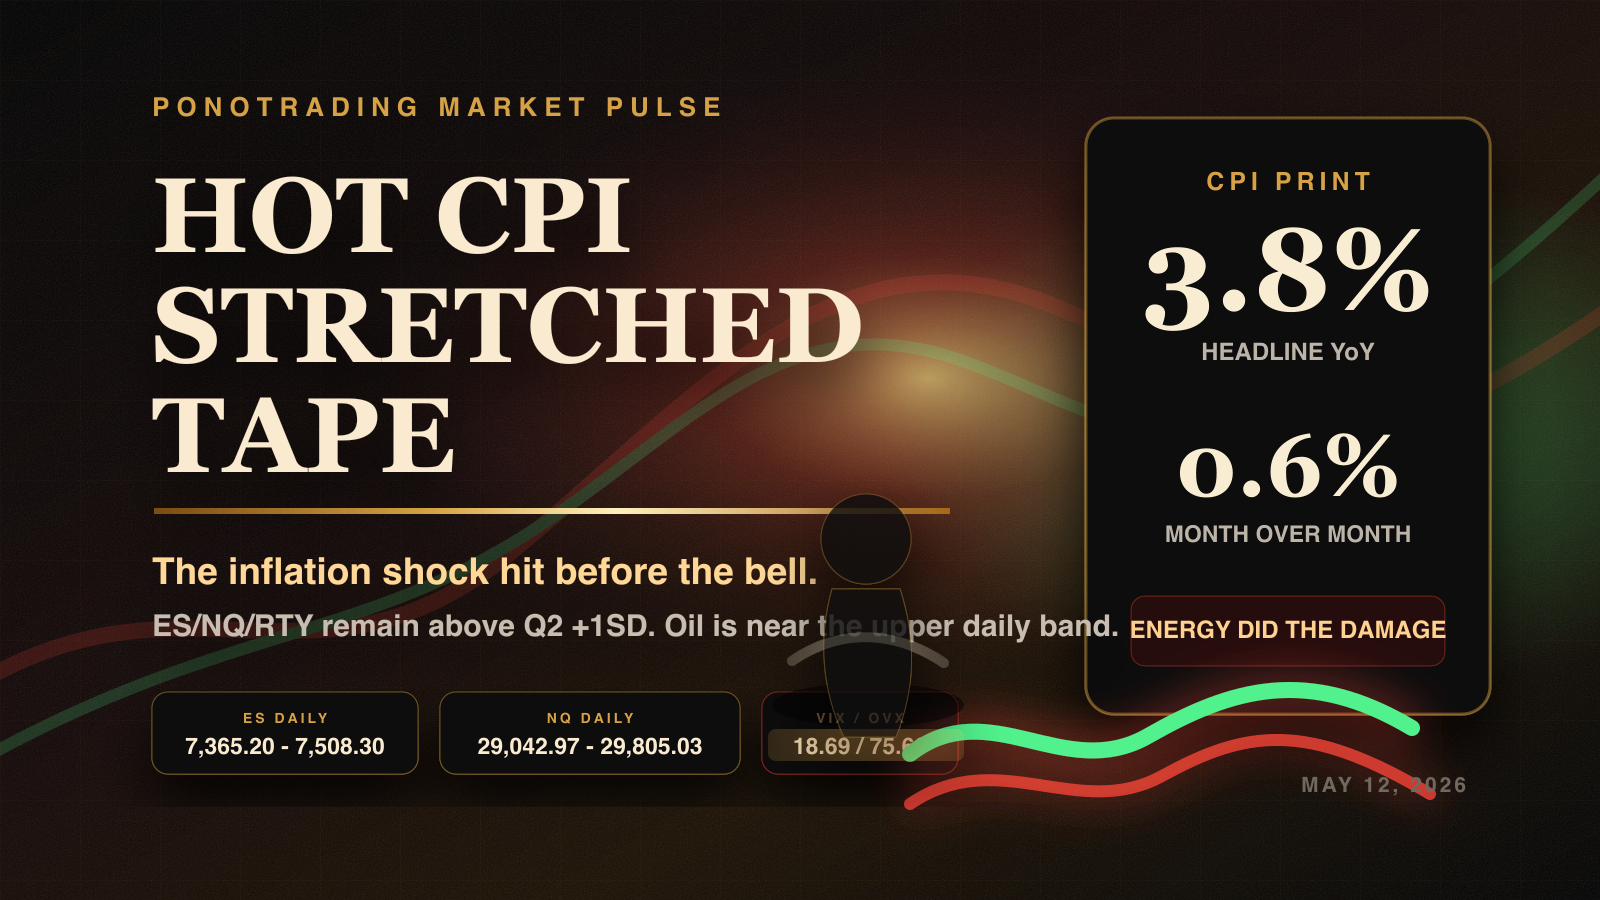
CPI came in hot before the bell, and it did not hit a market sitting in neutral. ES, NQ, and RTY were already stretched above their Q2 +1SD maps, VIX is back near 19, and crude is pressing close to the upper side of its daily expected move. This is a reaction day, not a prediction day.
What You Need To Know Right Now
The April CPI print just changed the tone of the morning.
Headline CPI rose 0.6% month over month and 3.8% year over year. Core CPI rose 0.4% month over month and 2.8% year over year. The most important detail is the composition: energy rose sharply and accounted for a large share of the monthly headline increase, while shelter also firmed. That means the market is not just dealing with a single number. It is dealing with the exact pressure point traders have been watching all week: oil, inflation sensitivity, and a stretched equity tape.
The PonoTrading expected-move run for Tuesday shows:
| Product | Current Reference | Daily 1SD Range | Planning Read |
|---|---:|---:|---|
| ES | 7,416.00 | 7,365.20 - 7,508.30 | Above Q2 +1SD; CPI tests acceptance above 7,399.17. |
| NQ | 29,203.25 | 29,042.97 - 29,805.03 | Still stretched on the quarterly map; watch 29,290.95 as a higher-timeframe magnet. |
| YM | 49,793 | 49,313 - 50,271 | Cleaner inside-range product unless the CPI reaction broadens. |
| RTY | 2,867.40 | 2,851.20 - 2,906.60 | Breadth stays constructive above daily lower 1SD and Q2 +1SD. |
| GC | 4,714.90 | 4,650.83 - 4,786.57 | Gold is the fear monitor if inflation/rates stress spreads. |
| CL | 101.07 | 94.19 - 101.95 | Crude is close to the upper daily band; above 101.95 raises the pressure. |
Volatility confirms this is not a sleepy session: VIX 18.69, VXN 24.74, GVZ 27.48, and OVX 75.66.
The core read is simple: inflation surprised the tape while equities were already in an expensive location. That does not automatically make the market bearish. It does mean long entries need more proof, failed breakouts matter more, and crude needs to stay on the screen.
Prior Session
Monday left the market with a constructive but stretched profile. Buyers were still willing to defend risk, AI leadership remained intact, and the broader index structure had not given a clean rejection from the highs.
The problem was location. ES, NQ, and RTY were not starting today from deeply discounted levels. They were already beyond quarterly +1SD expected-move zones. That makes today's CPI reaction more important than the CPI number by itself.
When a hot inflation print hits a market that is already extended, the first move can be emotional. The better signal usually comes after the first move: does price reclaim the stretched zones and hold, or does it fail back inside the expected-move map and start converting late buyers into supply?
That is the session problem today.
Overnight Markets
The overnight map was already showing a market with pressure underneath it. ES and NQ held near elevated levels, but volatility firmed. VIX is now 18.69, and VXN is 24.74, which means Nasdaq traders should expect wider rotations than a clean low-volatility melt-up.
Crude is the bigger cross-asset tell. CL is currently around 101.07 against a daily 1SD range of 94.19 - 101.95. That puts oil close enough to the upper band that traders cannot ignore it. If CL accepts above 101.95, the inflation story gets louder. If it rejects and slips back toward the midpoint near 98.07, equities may get breathing room even with a hot CPI print.
Gold is not screaming panic yet. GC is trading near 4,714.90 with a daily 1SD range of 4,650.83 - 4,786.57. If gold starts pressing toward or through the upper band while equities fail to reclaim, the market may be shifting from routine digestion into broader macro hedging.
US Futures
ES
ES is the cleanest read today because it is sitting right on the higher-timeframe decision area. The daily 1SD range is 7,365.20 - 7,508.30, and the Q2 +1SD boundary is 7,399.17.
Above 7,399.17 with acceptance, buyers can argue that the market is absorbing the CPI shock and still defending the trend. Below that zone, the CPI print becomes a reason to rotate back inside the distribution. The first downside reference is the daily midpoint near 7,436.75, followed by the daily lower band near 7,365.20.
The key is not whether ES spikes first. The key is whether it holds after the spike.
NQ
NQ remains the leadership product, but leadership is not the same thing as good location. The daily 1SD range is 29,042.97 - 29,805.03, and NQ remains far above its Q2 +1SD map. The monthly +1SD area near 29,290.95 is also important because price is working around that higher-timeframe zone.
If NQ can reclaim and hold above 29,290.95, buyers still have a path toward the upper daily band near 29,805.03. If it fails that area and starts accepting below 29,042.97, the stretched leadership trade becomes vulnerable to a deeper rotation.
RTY
RTY is the breadth check. The daily 1SD range is 2,851.20 - 2,906.60, and the Q2 +1SD boundary is 2,828.93.
As long as RTY holds above the daily lower band and Q2 +1SD, the market can still argue that risk appetite is not purely mega-cap driven. If RTY loses 2,851.20 and cannot reclaim, the bullish case becomes narrower.
CL
CL is the inflation switch. The daily 1SD range is 94.19 - 101.95, with current price near 101.07 and the upper band at 101.95.
If crude rejects the upper daily band, the CPI print may be treated as hot but manageable. If crude accepts above the upper band, the tape has to price a much more uncomfortable mix: hot CPI, elevated oil, and stretched equities.
Expected Move Map
Today's map is not about guessing direction. It is about knowing where the market is stretched and where reactions should matter.
| Product | Daily Midpoint | Daily 1SD | Daily 2SD |
|---|---:|---:|---:|
| ES | 7,436.75 | 7,365.20 - 7,508.30 | 7,293.66 - 7,579.84 |
| NQ | 29,424.00 | 29,042.97 - 29,805.03 | 28,661.95 - 30,186.05 |
| RTY | 2,878.90 | 2,851.20 - 2,906.60 | 2,823.51 - 2,934.29 |
| GC | 4,718.70 | 4,650.83 - 4,786.57 | 4,582.96 - 4,854.44 |
| CL | 98.07 | 94.19 - 101.95 | 90.30 - 105.84 |
The higher-timeframe alerts are still the story:
- ES quarterly: above +1SD
- NQ quarterly: above +1SD
- RTY quarterly: above +1SD
That cluster tells us the market is already extended. CPI does not need to crash the tape to matter. Even a controlled pullback can feel sharp when traders are positioned above higher-timeframe expected-move bands.
Market-Moving Headlines
The headline stack is inflation first.
April CPI came in hot at +0.6% month over month and +3.8% year over year. Core CPI also firmed at +0.4% month over month and +2.8% year over year. Energy and shelter are the important pieces because they keep the inflation conversation tied directly to crude, rates, and consumer pressure.
Oil remains the second headline. CL near the upper daily band means traders should not dismiss the energy component as a stale data point. If oil backs away from resistance, equities can attempt to stabilize. If oil accepts higher, the CPI story gets fresh fuel.
The third headline is still equity positioning. A hot print is different when ES and NQ are sitting in the middle of a balanced monthly range. That is not today's setup. Today's setup is hot CPI landing on an already stretched risk tape.
Economic Calendar
| Event | Timing | Market Read |
|---|---|---|
| CPI | Released this morning | Hot headline and firmer core; reaction matters more than the first spike. |
| Treasury/rate reaction | All session | Watch whether yields confirm inflation stress or fade the move. |
| Crude oil response | All session | The CPI energy component makes CL a key confirmation product. |
| Fed commentary | Ongoing | Any pushback against easing expectations can pressure extended risk. |
| PPI / Retail Sales | Later this week | Follow-through catalysts after today's inflation reset. |
The market has enough information to move today. The question is whether price accepts the new information or rejects the emotional reaction.
Earnings On Deck
Earnings still matter because large-cap technology and AI leadership have been carrying the risk-on structure. NQ can remain strong if leadership continues to absorb macro pressure.
But the CPI print raises the bar. When inflation firms, valuation-sensitive growth trades need cleaner confirmation. If AI leaders hold bid while ES and RTY defend their key levels, the bull case survives. If leadership narrows and RTY starts losing its daily lower band, the rally becomes more fragile.
The tell is breadth. Strong leaders plus weak participation is not the same as a healthy tape.
The Plan
Bull Case
The bull case is that the CPI reaction gets absorbed. ES holds above 7,399.17, NQ reclaims or holds around 29,290.95, RTY stays above 2,828.93, and crude rejects the upper daily band.
If that happens, buyers can keep pressing. But the best long trades still need structure: pullback-hold, reclaim, or acceptance above a prior decision zone. Chasing a CPI spike without confirmation is the lowest-quality version of the trade.
Bear Case
The bear case is rejection, not just a hot number.
If ES loses 7,399.17 and cannot reclaim, if NQ fails below 29,290.95, or if RTY loses 2,851.20, the market can rotate lower from an extended location. If CL accepts above 101.95 at the same time, the downside case gets much cleaner.
Best Trade Location
| Setup | Trigger | First Planning Target |
|---|---|---|
| ES reclaim long | Holds/reclaims Q2 +1SD near 7,399.17 | Daily upper band near 7,508.30 |
| ES failed acceptance | Rejects Q2 +1SD after the CPI reaction | Daily midpoint near 7,436.75 |
| NQ leadership reclaim | Reclaims 29,290.95 with breadth confirmation | Daily upper band near 29,805.03 |
| RTY breadth warning | Loses 2,851.20 and cannot reclaim | Reduce confidence in broad risk-on |
| CL inflation trigger | Accepts above 101.95 | Watch for equity de-risking impulse |
Mindset
This is exactly the kind of morning where traders get baited into certainty.
Hot CPI sounds bearish. Stretched equities sound bearish. AI leadership and strong trend structure sound bullish. All of those can be true at the same time, which is why the reaction matters more than the opinion.
Let price show whether the market is accepting the inflation shock or rejecting the stretch. If price holds the key zones, the trend deserves respect. If price fails the zones, do not argue with the map.
The worst trade today is the emotional trade taken five minutes after the number because the story feels obvious.
Bottom Line
Tuesday's Market Pulse is a heat check.
CPI came in hot, energy is back in the inflation story, and crude is close to the upper daily expected-move band. At the same time, ES, NQ, and RTY are still sitting above quarterly +1SD levels. That is not a quiet setup. That is a market asking whether buyers can keep accepting higher prices after a macro shock.
Respect the trend, but demand cleaner structure. If the market absorbs CPI and crude fades, risk can stabilize. If the market rejects the stretched zones while crude presses higher, the pullback can accelerate faster than traders expect.
For traders who want the workflow layer behind these notes, the PonoTrading Prep Room is where we organize daily levels, expected moves, and execution checklists:
https://ponotrading.com/join
Read more at PonoTrading.com, or join the free PonoTrading Prep Room.
Continue the work
Get the next market note in your inbox.
Subscribe free for new Market Desk articles, then join the PonoTrading Prep Room when you are ready to bring the work into the daily flow.
Enter the Free Prep Room