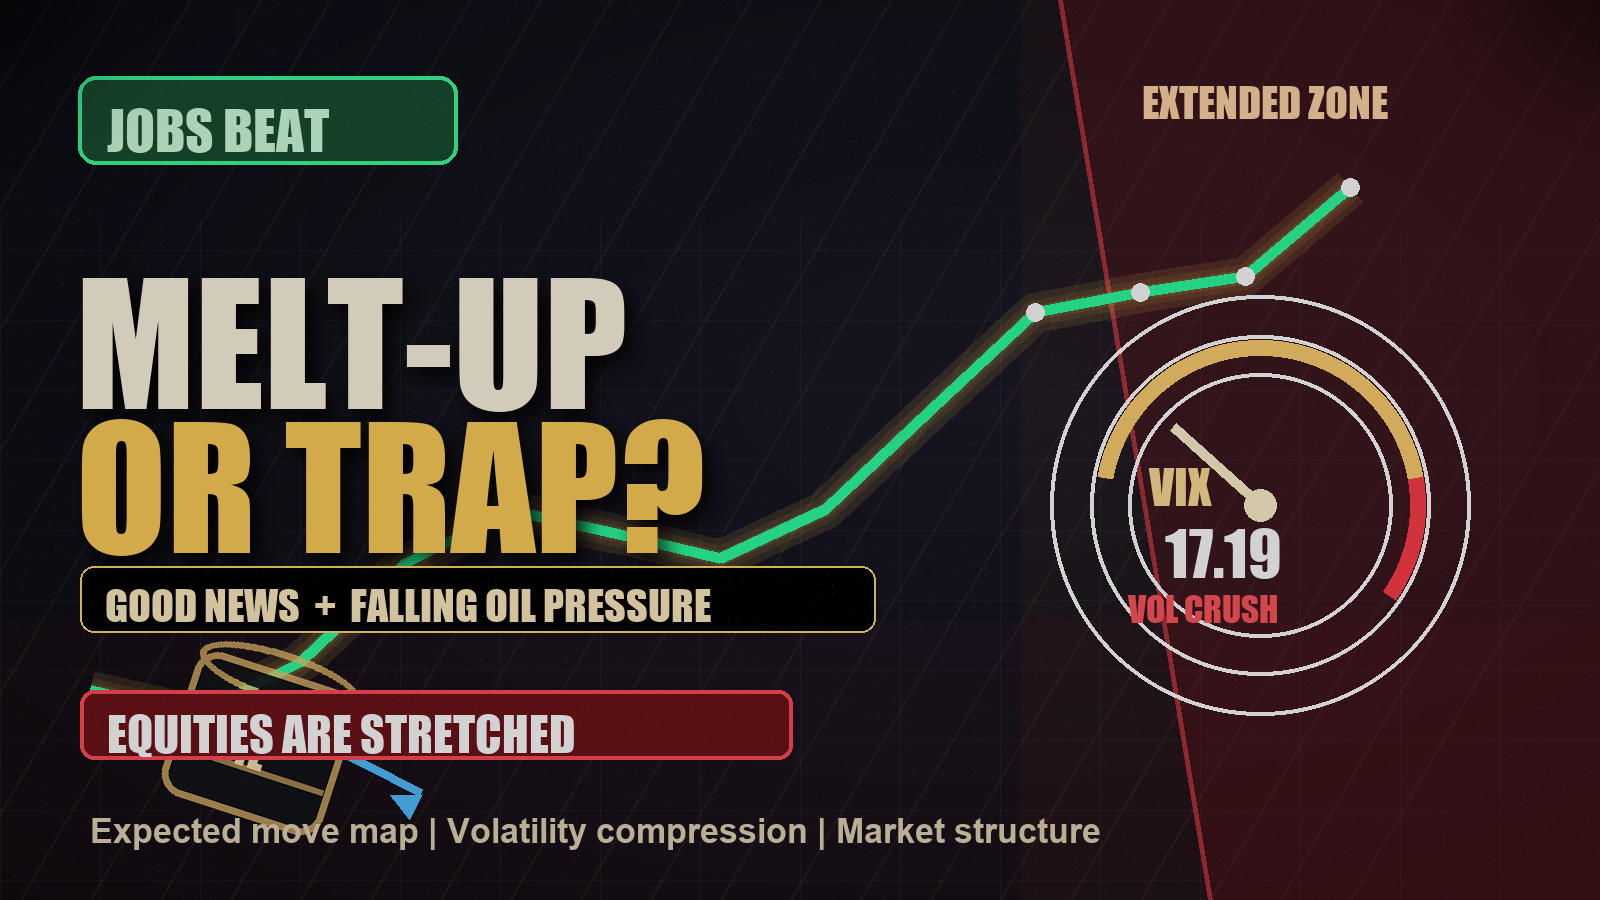
The Quiet Danger in This Rally: Volatility Is Falling While Equities Are Stretched
Jobs strength cooled recession fear, oil pressure backed down, and volatility compressed. That is exactly why the current equity extension deserves respect.
The market is doing the thing that makes traders feel safe at exactly the wrong moment.
Jobs came in stronger than feared. Oil pressure backed down from the danger zone. Volatility compressed. Equity indexes pushed into record territory.
That combination sounds bullish, and in many ways it is. But for traders, the question is not whether the news feels good. The question is whether price is still offering clean asymmetry from the current location.
Right now, the more honest read is this:
This is not a bearish call. It is a location call.
The tape can keep grinding higher. Momentum can stay sticky. Volatility can remain pinned longer than traders expect. But when multiple equity futures are pressing beyond higher-timeframe expected-move levels while volatility is calm, the risk changes. The market stops rewarding casual chasing and starts demanding better execution.
The setup: good news, lower fear, compressed volatility
The April jobs report gave the market something it wanted: enough labor-market strength to reduce slowdown fear without immediately forcing panic around the growth outlook. Nonfarm payrolls increased by 115,000, and unemployment held at 4.3%.
That does not mean the economy is flawless. It means the market received a cleaner answer than it was bracing for.
At the same time, oil pressure backed down from the higher-stress area of the map. Crude oil remains capable of moving violently, but the immediate read was less inflationary pressure than the market had been pricing around earlier in the week.
Then volatility did what volatility often does when the market gets relief: it compressed.
| Gauge | Reading |
|---|---|
| VIX | 17.19 |
| VXN | 23.76 |
| GVZ | 26.48 |
| OVX | 72.15 |
Volatility snapshot from the May 8, 2026 expected-move run.
VIX near 17 is not a panic regime. It is a calmer tape. That matters because calmer tapes invite buyers, systematic exposure, premium selling, and the kind of slow-motion melt-up that can feel effortless until price reaches a bad location.
The problem is location
The expected-move map is where the story gets serious.
NQ finished at 29,332.50. That placed it beyond the weekly +1SD level of 28,680.73, beyond the monthly +1SD level of 29,290.95, and well beyond the Q2 +1SD level of 27,287.17.
That is a major extension profile.
ES finished at 7,419.00, just beyond the Q2 +1SD level of 7,399.17.
RTY finished at 2,867.60, beyond the Q2 +1SD level of 2,828.93.
This does not mean the market has to reverse. Expected moves are not magic resistance lines. They are volatility-defined risk zones. They tell us when price has traveled far enough that continuation requires acceptance, not assumption.
| Product | Current Price | Stretch Read |
|---|---|---|
| ES | 7,419.00 | Above Q2 +1SD at 7,399.17 |
| NQ | 29,332.50 | Above weekly, monthly, and Q2 +1SD |
| RTY | 2,867.60 | Above Q2 +1SD at 2,828.93 |
| CL | 95.42 | Below the weekly anchor at 101.94, inside a wide oil-volatility regime |
| VIX | 17.19 | Compressed, not panicked |
The headline is not short the market. The headline is respect the stretch.
Why lower volatility can become dangerous
A lot of traders only fear high volatility. That is understandable because high volatility feels violent. It produces larger candles, wider spreads, faster reversals, and more emotional decision-making.
But low and falling volatility creates a different kind of risk.
It makes continuation look easy.
When volatility compresses while price extends, traders can start confusing smooth price action with low risk. They add late. They increase size because the tape feels calm. They chase upside breakouts without checking whether price is already outside the volatility budget.
That is where the trap lives.
Not because the market must collapse, but because the next pullback from a stretched location can feel sharper than the volatility regime implied. When everyone has been trained by a smooth tape to expect shallow dips, the first real two-way auction can catch late buyers leaning the wrong way.
Oil cooled, but energy volatility did not vanish
Crude oil closed around 95.42, below the weekly anchor of 101.94. That is part of why the market could breathe.
The daily crude map was 91.22 to 98.40 for the 1SD range. The weekly 1SD range was much wider at 91.30 to 112.58. That tells us oil pressure cooled in the immediate tape, but the broader energy-volatility backdrop is still wide.
That distinction matters.
Lower oil pressure can support risk appetite because it reduces the immediate inflation and consumer-pressure narrative. But OVX at 72.15 says energy remains capable of producing outsized movement. Traders should not treat oil as solved. They should treat it as less immediately disruptive until price proves otherwise.
What confirms continuation
For the rally to stay clean, the market needs acceptance.
NQ holding above the monthly +1SD level at 29,290.95 would keep the melt-up structure intact. ES holding above its Q2 +1SD level at 7,399.17 would show buyers are accepting price in the extended zone rather than merely tagging it. RTY holding above 2,828.93 would confirm that the broadening participation still has legs.
The volatility side matters too. If VIX stays calm and does not begin expanding through the session, the tape can keep rewarding pullback buyers. In that environment, the best trades usually come from structured reclaims, clean retests, and patience near defined levels.
What warns of a trap
The warning signs are just as clear.
If NQ loses 29,290.95 and cannot reclaim it, the market is telling us the monthly extension failed. If ES falls back under 7,399.17 and starts accepting below it, the Q2 extension becomes less supportive. If VIX wakes up while indexes are failing back inside their expected-move bands, the character of the tape changes.
Oil is another tell. A clean move back above the upper daily crude range around 98.40 would bring energy pressure back into the conversation. That does not automatically break equities, but it changes the risk math.
How to trade this without guessing
The mistake is picking a side because the story sounds exciting.
The better approach is to let the map do its job.
Above the extension levels, do not blindly fade. Wait for failed acceptance, loss and reclaim behavior, or volatility expansion that confirms sellers are actually gaining control.
Below the extension levels, do not assume the rally is dead. Look for whether price can rebuild acceptance back above the key levels. A failed breakdown in a compressed-volatility tape can turn into another squeeze.
This is where expected moves earn their place in the process. They do not predict the future. They organize the battlefield.
The real read
The market has a bullish surface:
- Better-than-feared jobs data
- Oil pressure backing away from the immediate danger zone
- Lower volatility
- Index strength at or near record territory
But the structure underneath is more demanding:
- NQ is stretched across weekly, monthly, and quarterly maps
- ES and RTY are pressing beyond Q2 +1SD levels
- Volatility is compressed enough to encourage late chasing
- Energy volatility remains elevated even with crude cooling
That is the quiet danger in this rally.
The news got better. The fear came down. The tape got smoother.
And now the market is sitting in a location where discipline matters more, not less.
For traders who want the workflow layer behind these notes, the PonoTrading Prep Room is where we organize daily levels, expected moves, and execution checklists.
Continue the work
Get the next market note in your inbox.
Subscribe free for new Market Desk articles, then join the PonoTrading Prep Room when you are ready to bring the work into the daily flow.
Enter the Free Prep Room